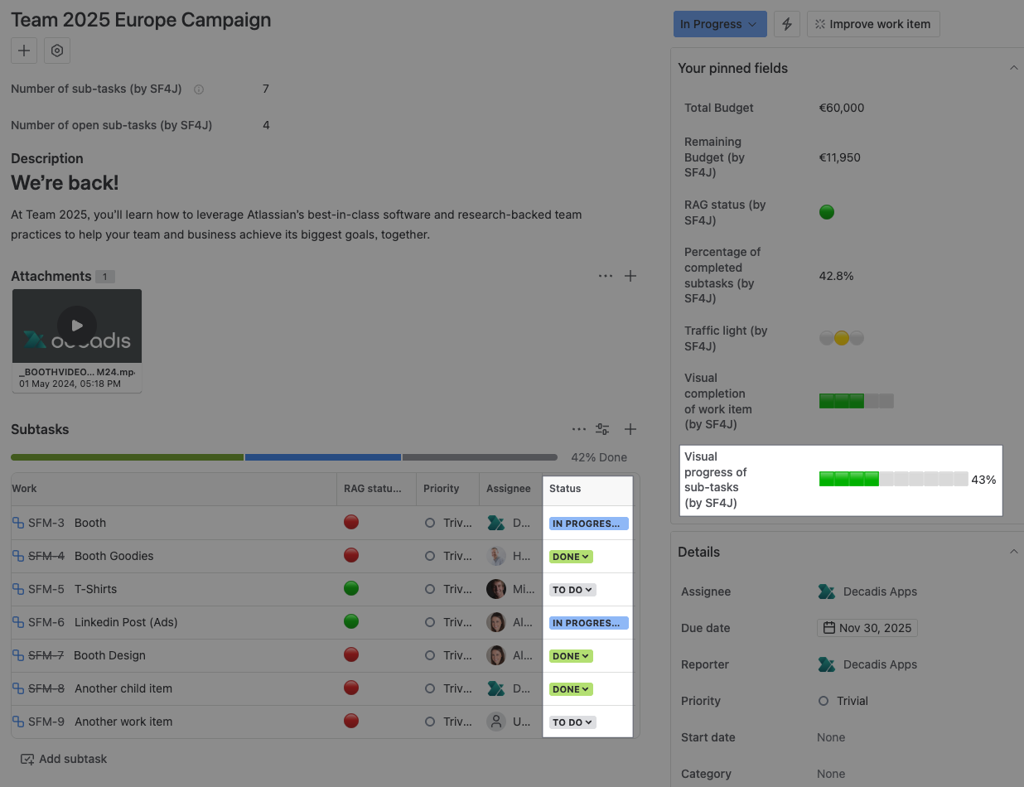
Return a visual bar depending on each sub-task status.
Configuration
Select Custom text formula in the template gallery after clicking Create formula field.
Choose General in the parsing mode dropdown. Click here for additional information.
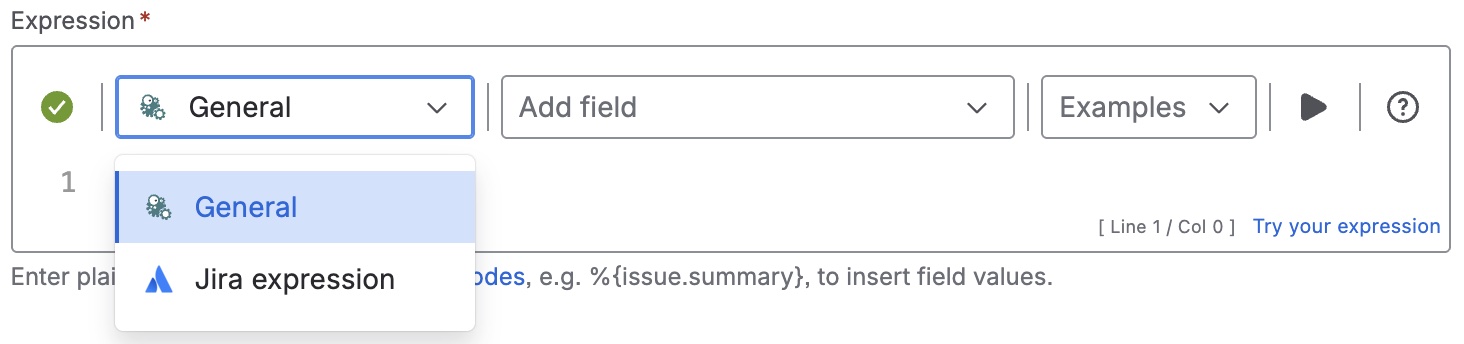
Expression
let subtasks = issue.subtasks|| [];
if (subtasks.length == 0){
    'No sub-tasks'
  }
  else
  {
    let doneSubtasks = subtasks.filter(s => s.status.name == "Done");
    let value = (doneSubtasks.length / subtasks.length) * 100;
    let percent =  value - value % 1 + (value % 1 >= 0.5 ? 1 : 0) ;
    let totalBlocks = 10;
    let filled = (percent / 100) * totalBlocks;
  	let full = filled - filled % 1 + (filled % 1 >= 0.5 ? 1 : 0);
    let bar = '🟩'.repeat(full) + '⬜️'.repeat(totalBlocks - full);
  `${bar} ${percent}%`
 }
Please, replace the status names as well as the completion emojis with the ones of your choice.
Details
1. What does the expression do?
This expression creates a visual progress bar that shows how many sub-tasks of a work item are completed (in the "Done" status). The bar uses colored emojis to represent progress and displays the percentage of completed sub-tasks.
2. Step-by-step breakdown
Let’s break down the expression step by step:
-
Get the list of sub-tasks:
let subtasks = issue.subtasks || [];-
This retrieves all sub-tasks for the current work item. If there are no sub-tasks, it uses an empty list.
-
-
Check if there are any sub-tasks:
if (subtasks.length == 0) { 'No sub-tasks' }-
If there are no sub-tasks, it simply returns the message "No sub-tasks".
-
-
Filter sub-tasks that are done:
let doneSubtasks = subtasks.filter(s => s.status.name == "Done");-
This creates a new list containing only the sub-tasks whose status is "Done".
-
-
Calculate the completion percentage:
let value = (doneSubtasks.length / subtasks.length) * 100; let percent = value - value % 1 + (value % 1 >= 0.5 ? 1 : 0);-
It divides the number of completed sub-tasks by the total number of sub-tasks, multiplies by 100, and rounds to the nearest whole number.
-
-
Set up the progress bar:
let totalBlocks = 10; let filled = (percent / 100) * totalBlocks; let full = filled - filled % 1 + (filled % 1 >= 0.5 ? 1 : 0);-
The progress bar will have 10 blocks (emojis). The number of filled blocks is based on the completion percentage, rounded to the nearest whole block.
-
-
Build the visual bar:
let bar = '🟩'.repeat(full) + '⬜️'.repeat(totalBlocks - full);-
It creates a string with green blocks (🟩) for completed progress and white blocks (⬜️) for the remaining.
-
-
Display the result:
`${bar} ${percent}%`-
The final output is the visual bar followed by the percentage of completion (e.g., 🟩🟩🟩⬜️⬜️⬜️⬜️⬜️⬜️⬜️ 30%).
-
3. Examples
-
If a work item has 4 sub-tasks and 2 are "Done":
-
Completion: 2/4 = 50%
-
Bar: 🟩🟩🟩🟩🟩⬜️⬜️⬜️⬜️⬜️ 50%
-
-
If a work item has 5 sub-tasks and all are "Done":
-
Completion: 5/5 = 100%
-
Bar: 🟩🟩🟩🟩🟩🟩🟩🟩🟩🟩 100%
-
-
If there are no sub-tasks:
-
Output: No sub-tasks
-
4. Real-life use cases
-
Sprint tracking: Show at a glance how many sub-tasks are completed for each work item in a sprint.
-
Team analysis: Visualize progress on tasks that are broken down into smaller steps.