Use case
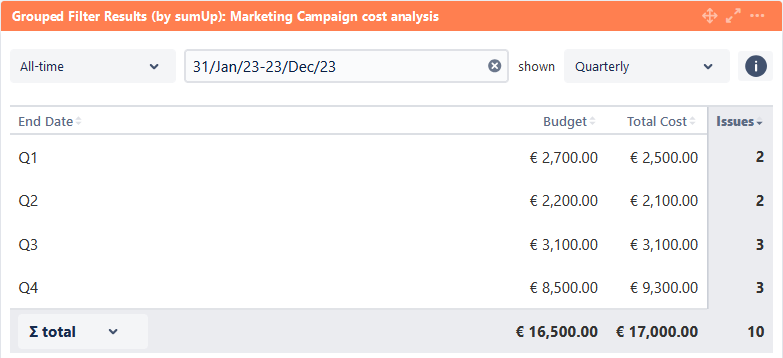
Track and compare actual costs against budget per quarter. This view summarizes financial data to support transparent budget analysis across time periods.
Version 3.8.0 or higher is required!
You can tweak the date options on top of the gadget at any time without destroying your configurations.
Configuration
|
Option |
Settings |
|---|---|
What is the name of your gadget?
|
A precise name like Marketing Campaign cost analysis makes it easy to locate the gadget on the dashboard. |
Which issues do you want to analyze?
|
Select the Filter Filter for "Marketing Campaigns", which returns all issues of the Marketing Campaign project and was defined in advance. |
Which fields would you like to display?
|
To use the custom number fields Budget and Total Costs you have to create a custom calculation rule for the respective fields you want to sum up. Then select the fields in the gadget. |
How do you want to group the results?
|
Group the results by End Date to ensure the costs are correctly grouped. End Date is a custom date field that must also be created. |
How many rows do you want to display per page?
|
For a quarterly view, there are only four entries. Therefore, the default option of 10 rows is enough. |
Which time period do you want to display as default?
|
To view all data, select All-time. |
Which default for the date aggregation level do you choose?
|
If you choose the Quarterly option, the data is displayed per quarter. |
Refresh Interval
|
Select the default value Never, so that the data is not automatically reloaded, only when the gadget is reloaded or a manual refresh is performed. |