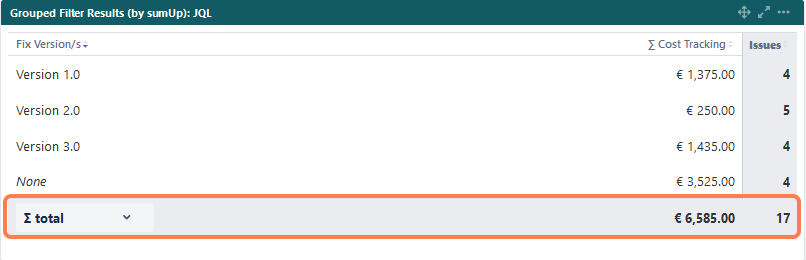
The Grouped Filter Results (by sumUp) gadget calculates sums of multiple fields while the source issues are grouped by one custom field.
Configuration
|
Options |
Explanation |
|---|---|
What is the name of you gadget?
|
Optionally, type in a name for the gadget. |
Which issues do you want to analyze?
|
Select an existing filter or Custom JQL to define the issues that you want to analyze. Using Custom JQL allows you to narrow down the result set ad-hoc without the need to create a filter. |
Which fields would you like to display?
|
Select the field that you want to calculate a sum for. Only certain fields can be summed up (e.g., numeric fields, text fields with numeric values, etc.). |
How do you want to group the results?
|
Select a field to group the results on the y-axis, such as Issue type or Status. |
How many rows do you want to display per page?
|
Choose how many rows (x-axis) you want to display when viewing the gadget. Additional results will be paginated. The sum rows will show the total of all results regardless of the page they are on. |
|
SINCE VERSION 3.8.0 You only see the following options if you have picked a date or date-time field to show/group by on the y-Axis. |
|
Which time period do you want to display as default?
|
SINCE VERSION 3.8.0 Set a default time period for date or date-time field (e.g.,Due Date, Created): Current week, Current month, Current quarter, Current year, All-time |
Which default for the date aggregation level do you choose?
|
SINCE VERSION 3.8.0 Set a default aggregation level for date or date-time fields: Daily, Weekly, Monthly, Quarterly, Yearly |
Refresh Interval
|
You can choose between: Never, Every 15 Minutes, Every 30 Minutes, Every 1 Hour, Every 2 Hours If Never is selected, the gadget will only be refreshed on page reload. |
View mode
Some display options of the gadget, especially when using the date-drilldown, can be configured on the fly without entering Edit Mode.
Sorting
Click the small arrows next to each column header to sort the columns.
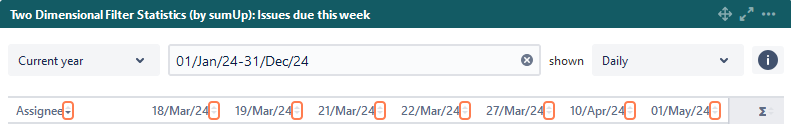
Date filter
An additional filter appears at the top when a date field is selected to show (group by) on the y-Axis, allowing you to view the data in a custom time period and aggregation level. It is pre-populated with the configuration value and contains the following options:
|
Options |
Explanation |
|---|---|
|
Time period |
Set the period which you want to display: Current week, Current month, Current quarter, Current year, All-time |
|
Date picker |
The picker allows you to override the Time period selection. Select the start and end dates by clicking on the dates. Click next to the expanded calendar to enter your chosen date. If the date range is not customized, it reflects the chosen Time period (e.g., 01/Jan/24-31/Dec/24 for Current year). Adjusting the date range changes the Date Filter View to Customized. |
|
Date grouping |
Define how you want to group the data: Daily, Weekly (W1, W2, W3, ...), Monthly (M1, M2, M3, ...), Quarterly (Q1, Q2, Q3, Q4), Yearly (Y/22, Y/23, Y/24, ...). For data spanning more than one year, Weekly, Monthly, and Quarterly data will display the year as a suffix (e.g., Q1/24). |
|
Info icon |
The tooltip |
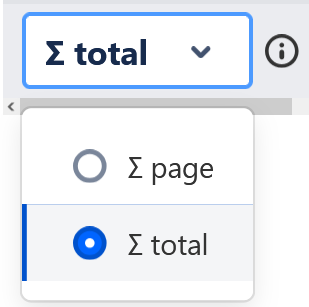
Overall vs. page totals
SINCE VERSION 3.8.0
You can choose between the overall ∑ total or the total of the ∑ page. Or you can choose between the Ø total or the Ø page, if you have selected average fields.
📚 Use cases and examples
| Use case | Description | Gadget |
|---|---|---|
| Comparison of Budget and Total Costs |
Compare previous year's budgets and costs on a quarterly basis. |
Grouped Filter Results |