Use case
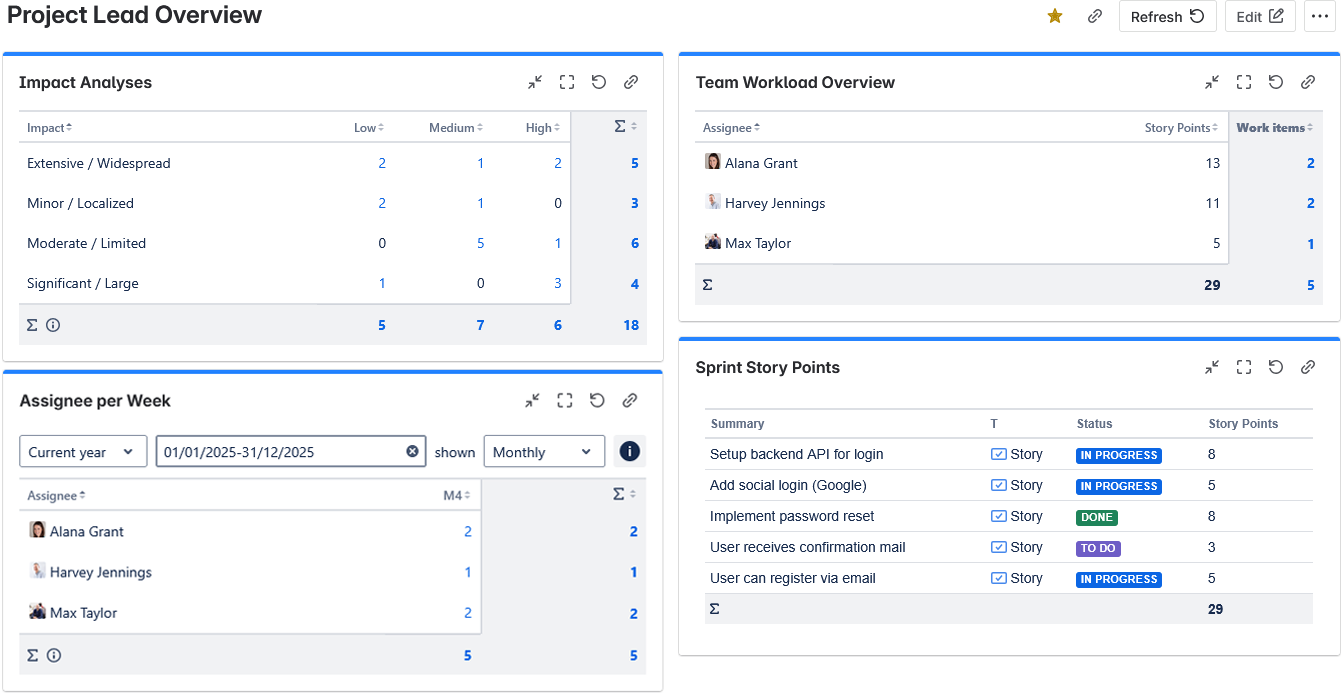
Use the Project Lead Overview to gain a clear understanding of team workload distribution, work item impact levels, and current sprint progress. This dashboard combines several sumUp gadgets to visualize real-time data on story points, task status, and resource allocation
Configuration
-
Go to Dashboard → Create a new Dashboard.
-
Enter a name for the dashboard.
-
Add gadgets by selecting Add Gadget.
-
Use the search bar to find and add the following gadgets one by one:
-
Two Dimensional Filter Statistics for Impact Analyses
-
Grouped Filter Results for Team Workload Overview
-
Two Dimensional Filter Statistics for Assignee per Week
-
Filter Results for Sprint Story Points
-
Configure each Gadget.
JQL : project = “sum”
Field to sum: Select Work items.
X-Axis: Choose cutom field Probability of Occurence.
Y-Axis: The number of affected customers is tracked with Impact.
Team Workload Overview configurations
JQL: project = "SUM" AND workitemtype= Story
Field to sum: Select Work items and Story Points.
Group by: Select Assignee.
Assignee per Week configurations
JQL: project = “SUM” AND status != DONE
Field to sum: Select the field Work item.
X-axis grouping: Choose Due Date.
Time period: Choose Current year.
Time interval: Choose weekly.
Y-axis grouping: select Assignee.
Sprint Story Points configurations
JQL: project = "SUM" AND issuetype = story
Display: Summary, Issue Type, Status and Story Points.