
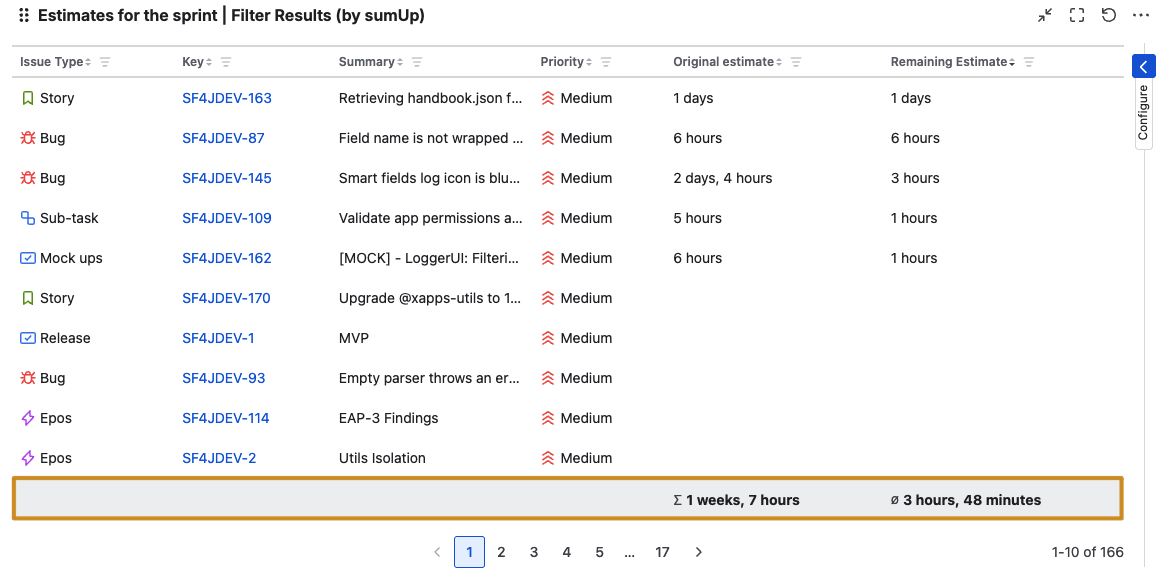
The Filter Results gadget closely resembles the standard Jira Filter Results gadget, but it includes an enhanced feature: a sum row that displays totals.
Essential configuration
|
|
|---|---|
|
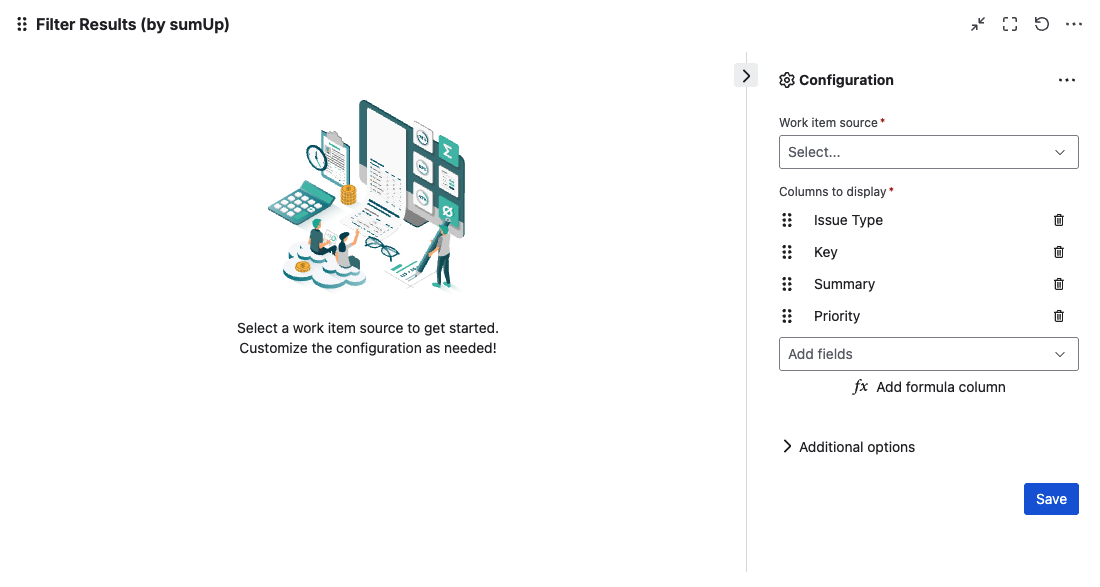
Work item source |
Select an existing filter or Custom JQL to define the issues that you want to analyze. Using Custom JQL allows you to narrow down the result set ad-hoc without the need to create a filter. |
|
Columns to display |
Select the fields that you want to display and / or sum up in columns and reorder them using drag & drop. Only certain fields can be summed up (e.g., numeric fields, time-duration fields, text fields with numeric values, etc.). See Supported Fields for a full list of supported fields. Additionally, you can also add a custom formula column by defining your own operation. Click a column heading on the table to sort fields ascending or descending. Status, Priority, and Resolution use the order defined on their Jira pages. |
Additional options
|
|
|---|---|
|
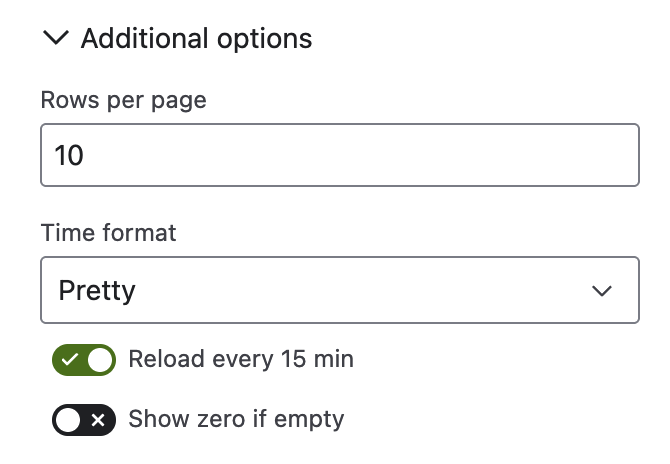
Rows per page |
Choose how many results (rows) you want to display when viewing the gadget. Additional results will be paginated. 
The sum row will show the total of all results regardless of the page they are on. |
|
Time format |
For duration fields like Original Estimate, Time Spent, etc. you can now choose a custom format such as Pretty, Compact, Days, Hours, or stick to System settings. |
|
Reload every 15 min |
Enabling this option is useful when displaying information that needs a periodic and automatic refresh, particularly when the gadget is displayed on a wallboard. |
|
Show zero if empty |
By default, empty numeric or time-based fields are displayed as blank. Enable this option if you prefer to show those values as zero. |
Gadget features
🛠️ Multiple aggregation modes
Users can select multiple aggregation modes for a given column. After selecting a field, click the cogwheel icon to configure its aggregation mode. You can also choose Sum or Average directly when selecting a field from the Add fields picker.
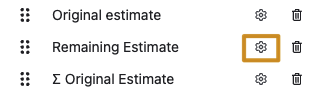
Subsequently, in the field configuration screen, you can between the aggregation modes for that field.
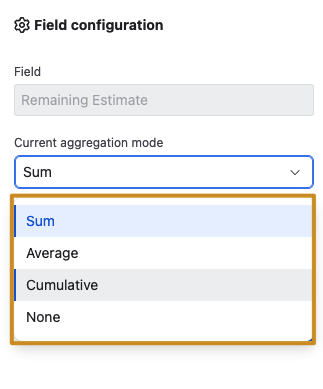
Please note that “sum“ is the default aggregation mode if an aggregation mode is not explicitly chosen.
🧠 Formula column
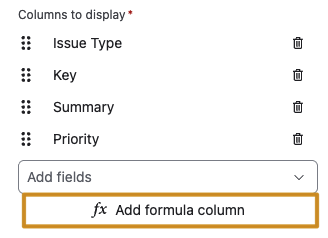
You can also add a calculated column by defining your own formula or choose one from the examples. To get started, click “Add formula column”.
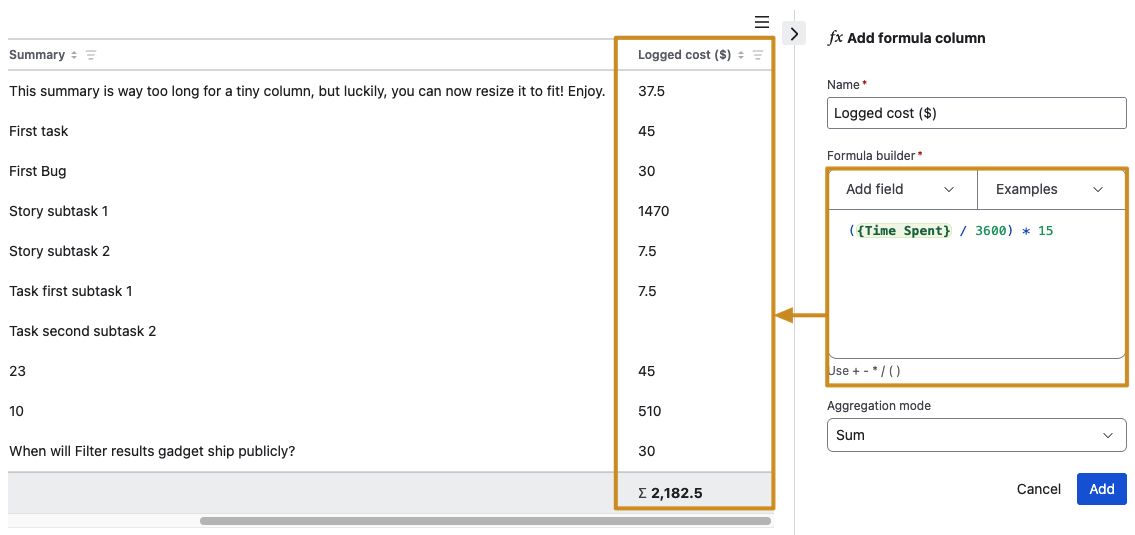
In the “Add formula” section, insert fields from the picker or type to get auto-suggestions. Combine fields with operators to build your formula. Optionally, you can also define the aggregation logic for the formula column. When you click outside the Formula builder, the calculated data appears automatically in the preview table.
Important considerations
-
Spreadsheet logic applies when empty fields combine with non-empty fields.
-
If all fields referenced in a formula are empty, the result remains empty.
-
Division by zero is not allowed and is marked as an error in the table.
🔽 Advanced column filtering
Unlock deeper insights and eliminate manual searching with our new intelligent column filters. Instead of scrolling through endless rows, you can now isolate critical information in seconds using filtering logic tailored to your specific data.
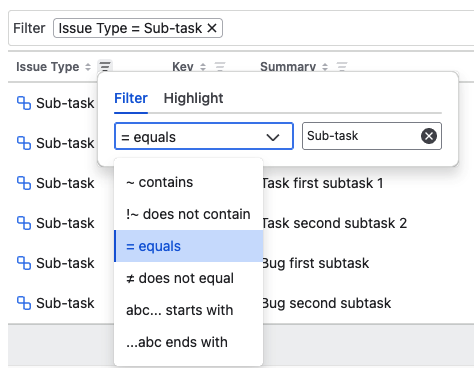
Pro tip: Apply filters to multiple columns to narrow your results further. The gadget automatically combines your criteria using logical AND, displaying only the records that meet all specified conditions.
Good to know
Filters are saved per user and remain persistent even after a page refresh.
📅 Dynamic date filtering/highlighting
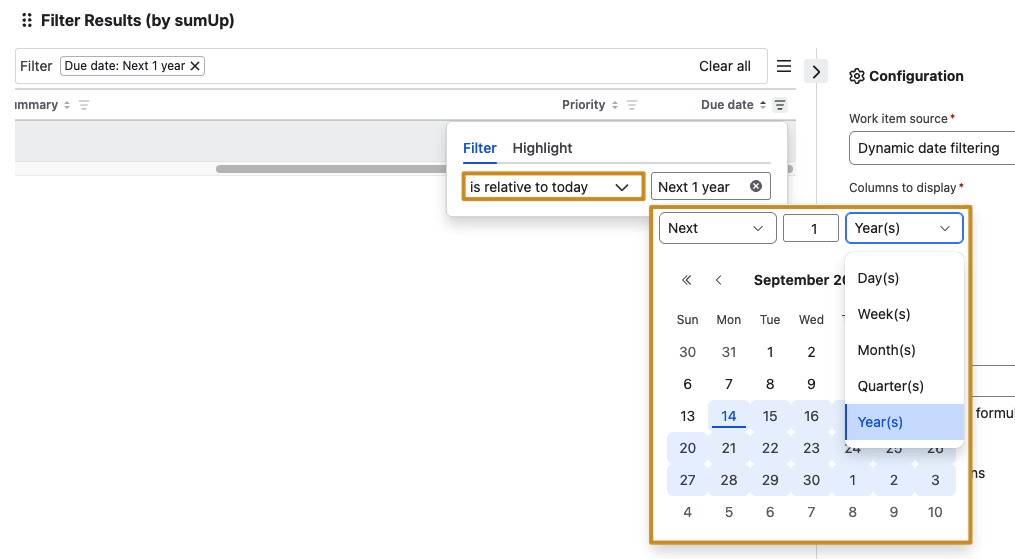
Use “is relative to today” to filter or highlight date and date-time fields. Choose the current day, week, month, quarter, or year, or enter a number of past or next periods, such as “Past 7 days” or “Next 2 weeks”. The calendar preview displays the matching date range, and your rules update automatically as the date changes, respecting your Jira timezone and week settings.
➗ Percentage share
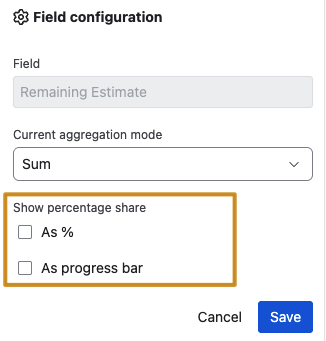
Besides absolute cell values, you can view a cell as a percentage or as a progress bar relative to its column total. To enable percentage share view, click the cog wheel icon for that field in the gadget configuration.
On the next screen, choose to show the cell value as a percentage, the progress bar, or both.
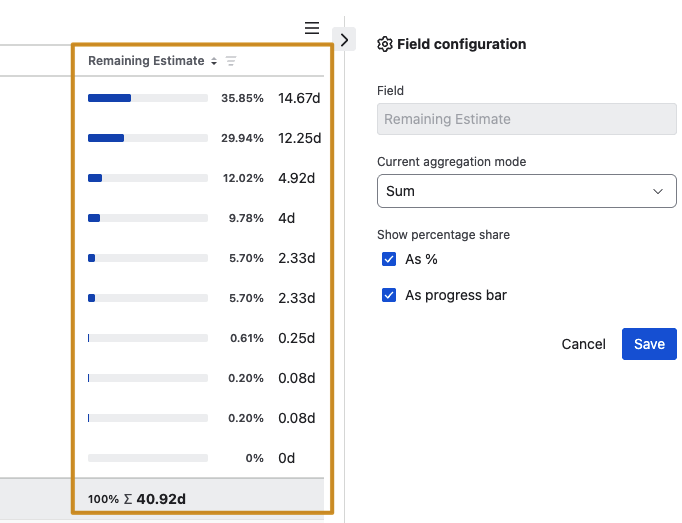
Your selection will appear immediately in the preview table after you pick and save your preferred percentage-share visualization.
🪪 Card view
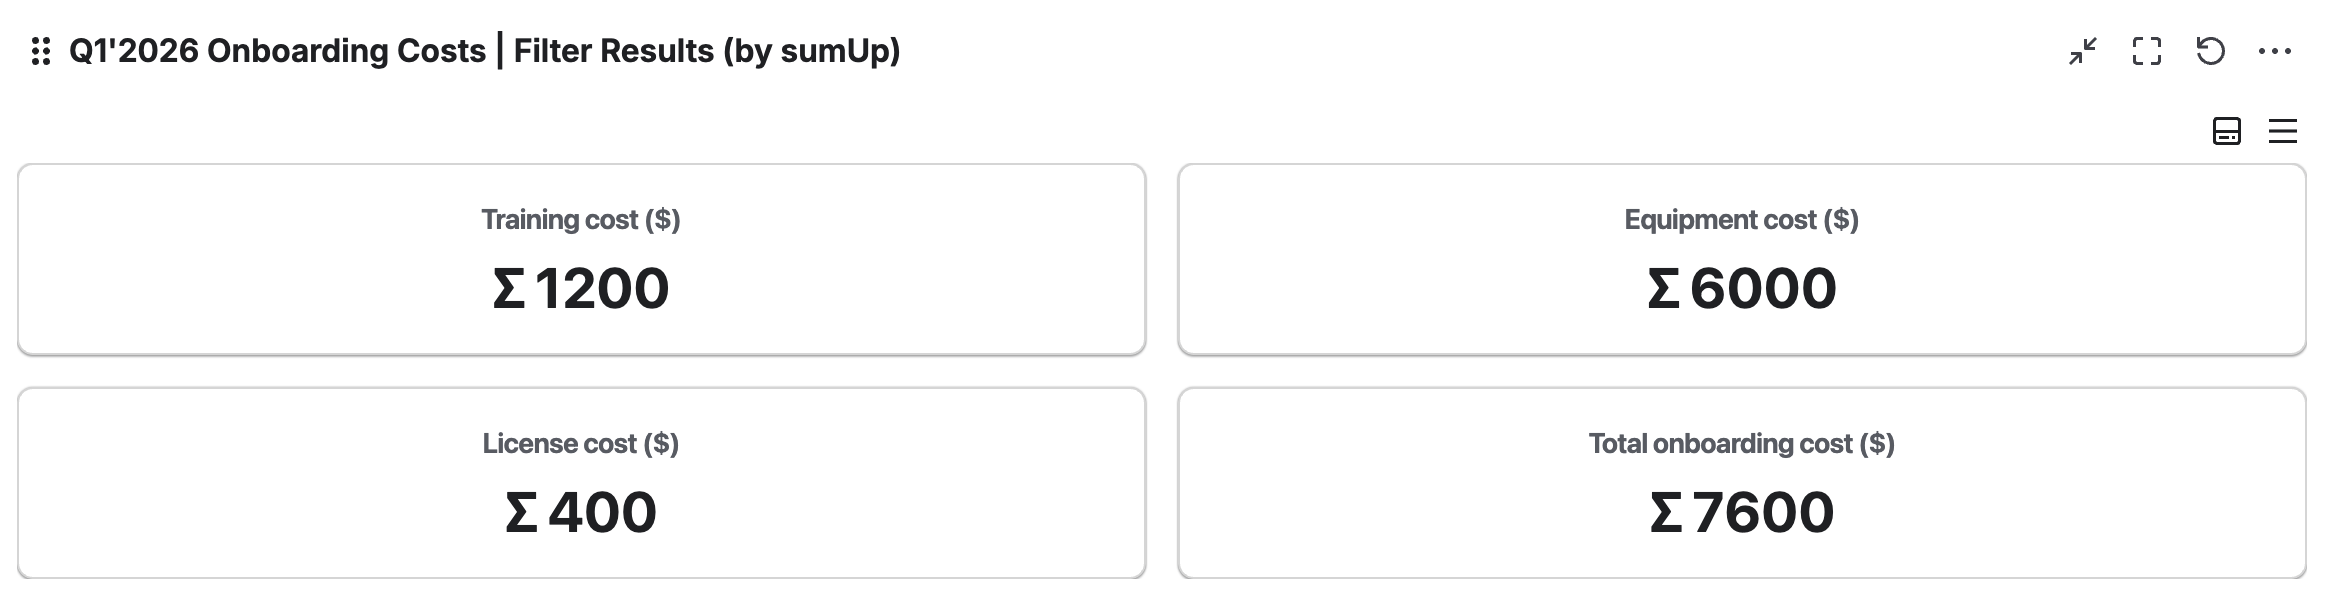
Switch from the detailed table view to a clean, KPI-style card view that highlights only the most important information.
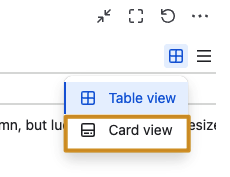
To enable it, click the table icon and select “Card view”. Aggregatable columns are then displayed as individual cards, with each card showing the column name and its aggregated value. This helps reduce visual clutter and makes key totals easier to scan at a glance.
✍️ Quick rename
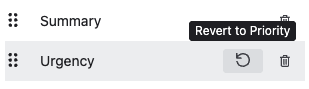
To align fields with your company glossary or preferred terminology, hover over a field and click to edit its name. To revert changes, hover over the field again and select “Restore to original name”.
Bring on the 🚀 ✨! We now offer full emoji support while renaming, so you can express fields yourself however you like.
🖌️ Conditional cell highlighting
Identify important data quickly without filtering, isolating, or losing the context of your current gadget view. Shed light on what matters most in your gadget data. Define highlight rules for a column, such as marking priority values like “Highest” or “High,” and matching cells will be visually emphasized using your chosen highlight color.
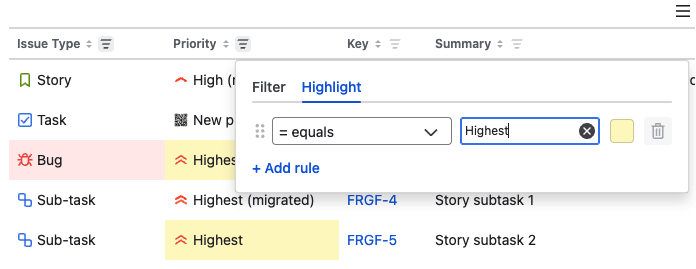
Pro-tip: You can define up to 3 highlight rules per column and can add highlight to as many columns that are present on the gadget table.
↔️ Manual column resize
Columns in the Filter Results gadget can now be resized manually to improve readability and better accommodate longer values.
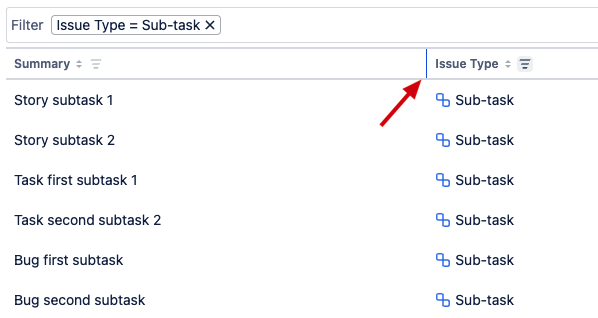
To resize a column, move your cursor over the column header. A gray vertical bar will appear between the columns, indicating that the column can be resized. When you hover over this bar, it will turn blue and the cursor will change to a resize icon. You can then click and drag the bar to the left or right to adjust the column width as needed.
📥 Export / CSV download
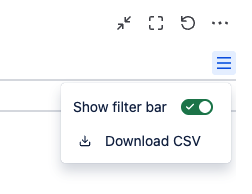
You can now download the gadget table as a CSV file directly from the gadget. Simply open the in-app menu and select Download CSV to export the full table for offline use, sharing, or further analysis.
📚 Use cases
| Title | Description |
|---|---|
| HR recruitment effort tracking |
Track total recruitment effort and projected hiring costs in real time to improve workforce planning and budget transparency. |
| Sprint capacity vs commitment tracking |
See committed against the logged and remaining effort of the current sprint. |
| Campaign budget tracker |
Track marketing campaign budgets comparing planned allocations vs actual spending. |
📚 Use cases (formula column)
| Title | Description |
|---|---|
| (fx) HR total hiring cost |
(fx) See total hiring cost for a position |
| (fx) Remaining operations budget |
(fx) Operations remaining budget |
| (fx) Total contract value |
(fx) See total contract values of software sales |