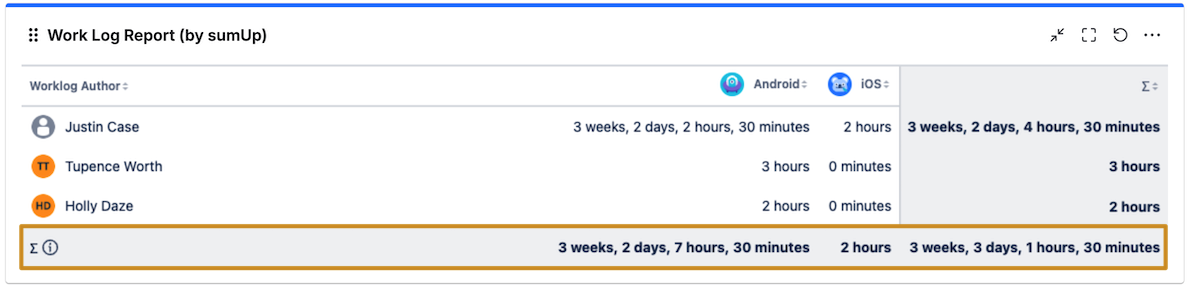
The Work Log Report is similar to the Two Dimensional Filter Statistics gadget, with the difference that it sums up work logs instead of numeric custom fields.
Configuration
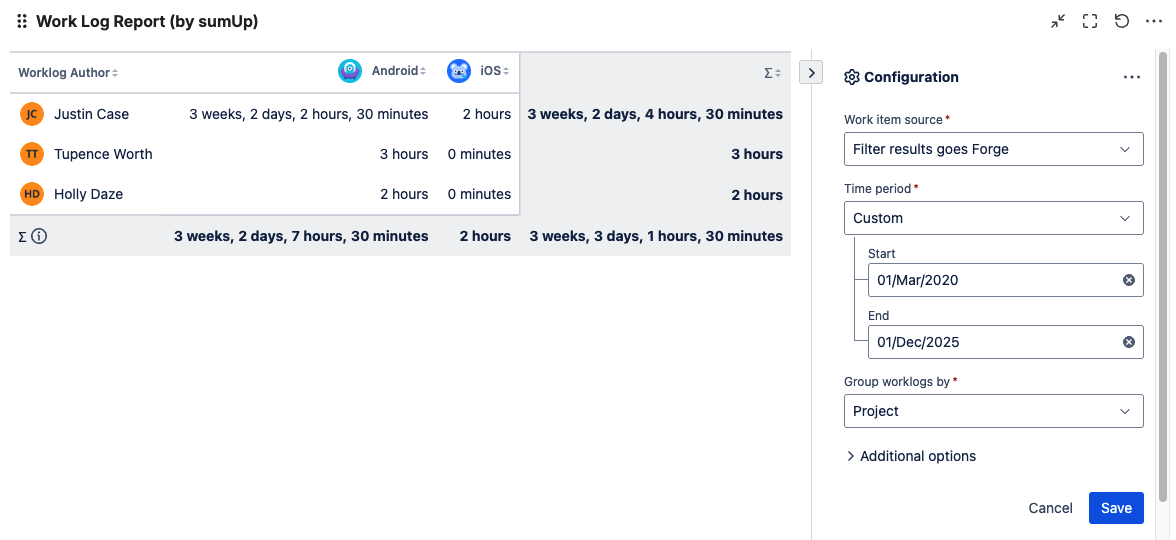
When you update any required configuration fields, the preview refreshes automatically.
|
Options |
Explanation |
|---|---|
Work item source
|
Select an existing filter or Custom JQL to define the issues that you want to analyze. Using Custom JQL allows you to narrow down the result set ad-hoc without the need to create a filter. |
Time period
|
Only time logs of the selected period will be displayed, with options including Current week, Last week, Last two weeks, Current month, Last month, and Custom. |
Group worklogs by
|
Select the field that will be used to group or aggregate the results by on the x-Axis, such as Sprint or Project. 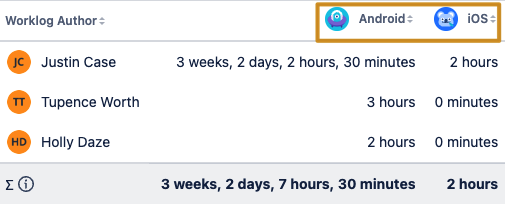
The y-axis will always display the name of each worklog author. |
|
Additional options |
|
|
Rows per page |
Choose how many rows (x-axis) you want to display when viewing the gadget. Additional results will be paginated. 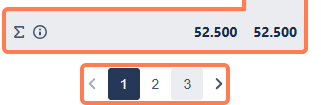
The sum rows will show the total of all results regardless of the page they are on. |
|
Time format |
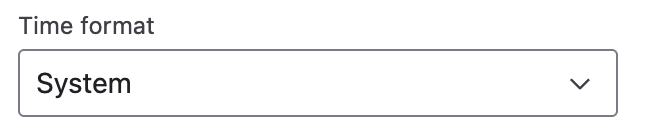
You can now visualize the work log entries in a custom format such as Pretty, Compact, Days, Hours, or stick to System settings. |
Reload every 15 min
|
Enabling this option is useful when displaying information that needs a periodic and automatic refresh, particularly when the gadget is displayed on a wallboard. |
Show work item links
|
Check this option to make each result clickable. Once you click any highlighted number you will see the underlying JQL query and results in the All work (formerly Issue Navigator).
Leave unchecked if you rarely use the All work view or experience slow loading times. |
Group by name
|
By default, results are grouped by their internal ID, which may result in some values/options (like Versions, Components, Work item type, Severity, Sprint, Status (especially in team-managed projects), option-based fields) showing up multiple times since they might have unique IDs. When checked, options with the same name are treated as one. before 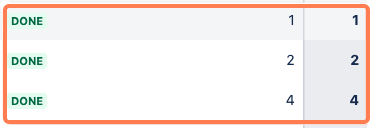
after |
|
Show zero if empty |
By default, unassigned values appear as empty spaces. To display them as zeroes, enable this option. before 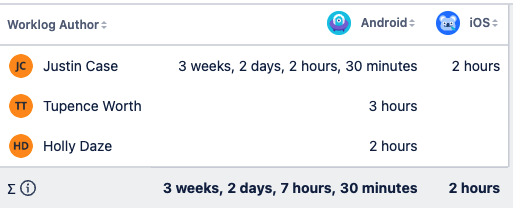
after 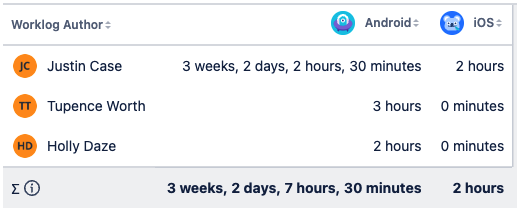
|
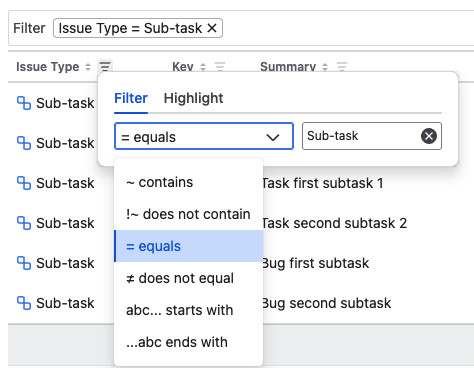
🔽 Advanced column filtering
Unlock deeper insights and eliminate manual searching with our new intelligent column filters. Instead of scrolling through endless rows, you can now isolate critical information in seconds using filtering logic tailored to your specific data.
Pro tip: Apply filters to multiple columns to narrow your results further. The gadget automatically combines your criteria using logical AND, displaying only the records that meet all specified conditions.
Good to know
Filters are saved per user and remain persistent even after a page refresh.
🖌️ Conditional cell highlighting
Identify important data quickly without filtering, isolating, or losing the context of your current gadget view. Shed light on what matters most in your gadget data. Define highlight rules for a column, such as marking priority values like “Highest” or “High,” and matching cells will be visually emphasized using your chosen highlight color.
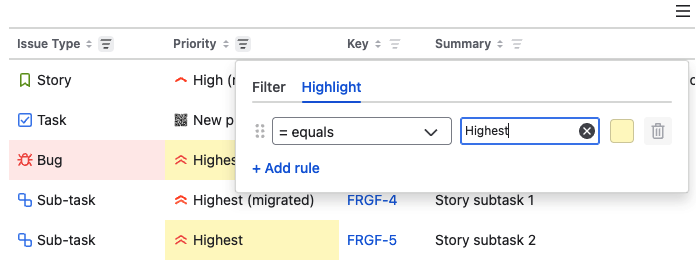
Pro-tip: You can define up to 3 highlight rules per column and can add highlight to as many columns that are present on the gadget table.
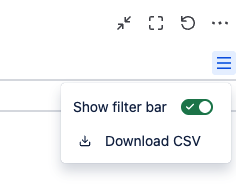
📥 Export / download CSV
You can now download the gadget table as a CSV file directly from the gadget. Simply open the in-app menu and select Download CSV to export the full table for offline use, sharing, or further analysis.