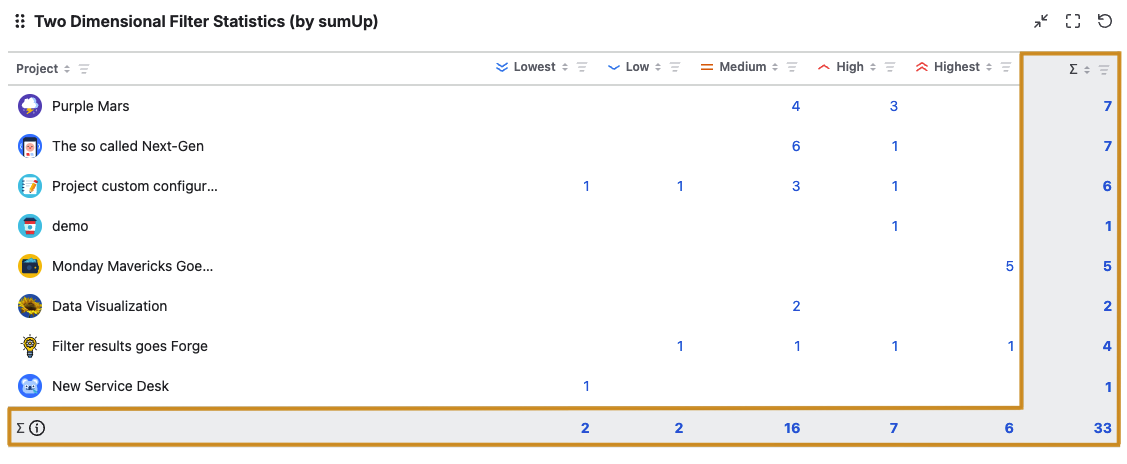
The Two Dimensional Filter Statistics essentially works exactly like the built-in Jira Two Dimensional Filter Statistics gadget - with additional totals for both columns and rows.
Configuration
When the configurations are adjusted, a preview is generated automatically.
|
Options |
Explanation |
|---|---|
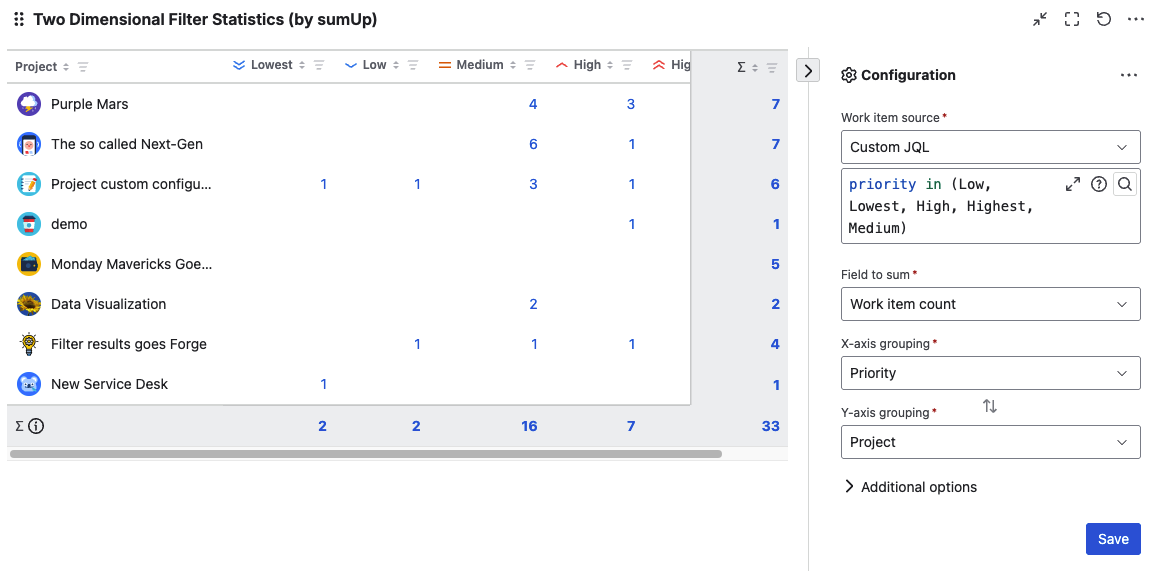
Work item source
|
Select an existing filter or Custom JQL to define the work item that you want to analyze. Using Custom JQL allows you to narrow down the result set ad-hoc without the need to create a filter. |
Field to sum
|
Select the field that you want to calculate a sum for. Only certain fields can be summed up (e.g., numeric fields, text fields with numeric values, etc.). See Supported Fields for a full list of supported fields. If you just want to count the number of work items (e.g. per status and assignee), then you must select Work item count. |
X-axis grouping
|
Select the field that will be used to group the results by on the x-axis. 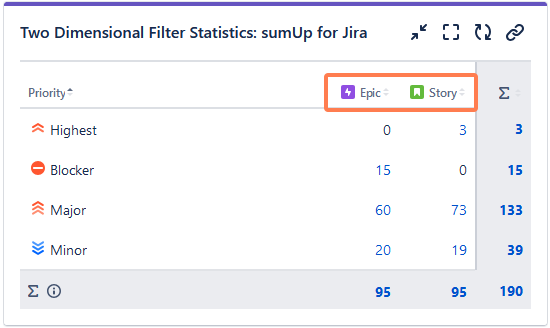
|
Switch x and y axis
|
To switch axes, simply click the two arrows. |
Y-axis grouping
|
Select the field that will be used to group the results by on the y-axis. 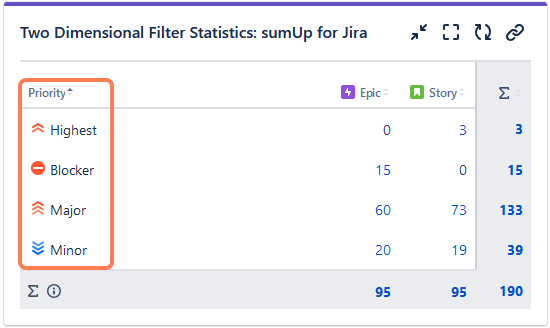
Click a column heading on the table to sort field ascending or descending. Status, Priority, and Resolution use the order defined on their Jira pages. |
|
You only see the following options if you have picked a date or date-time field to show/group by on the x- or y-axis. |
|
Time period
|
Set a default time period for date or date-time fields (e.g., Due Date, Created): Current week, Current month, Current quarter, Current year, All-time. |
Time interval
|
Set a default aggregation level for date or date-time fields: Daily, Weekly, Monthly, Quarterly, Yearly. |
|
Reorder the columns |
You can change the positions of the columns by simply clicking on the draggable handles before each column. 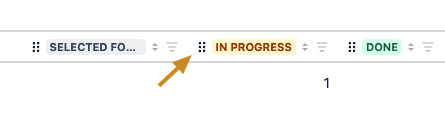
|
Additional options
|
Options |
Explanation |
|---|---|
Rows per page
|
Choose how many rows (x-axis) you want to display when viewing the gadget. Additional results will be paginated.
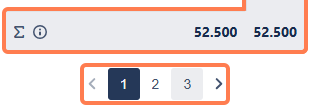
The sum rows will show the total of all results regardless of the page they are on. |
|
Time format |
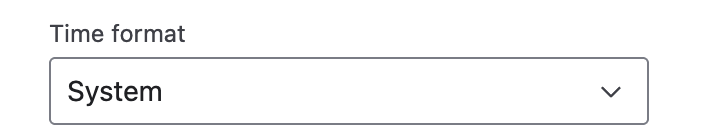
For duration fields like Original Estimate, Time Spent, etc. you can now choose a custom format such as Pretty, Compact, Days, Hours, or stick to System settings. |
Show work item links
|
Check this option to make each result clickable. Once you click any highlighted number you will see the underlying JQL query and results in the Work Item Navigator.
Leave unchecked if you rarely use the Work Item Navigator or experience slow loading times. |
Reload every 15 min
|
Enabling this option is useful when displaying information that needs a periodic and automatic refresh, particularly when the gadget is displayed on a wallboard. |
Group by name
|
By default, results are grouped by their internal ID, which may result in some values/options (like Versions, Components, Work item type, Severity, Sprint, Status (especially in team-managed projects), option-based fields) showing up multiple times since they might have unique IDs. When checked, options with the same name are treated as one. before 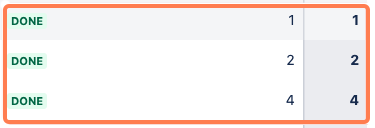
after |
|
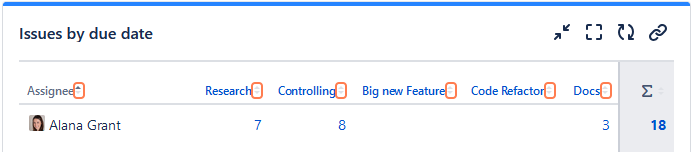
Show item count in cell |
When enabled, the number of work items will appear in parentheses within the table. 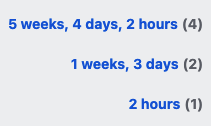
Note: This option is hidden if “Work item count” is selected. To use this feature, choose a different field e.g. “Original Estimate” in the Field to sum picker.
|
View Mode
Some display options of the gadget, especially when using the date-drilldown, can be configured on the fly without entering Edit Mode.
Sorting
Click the small arrows next to each column header to sort the columns.
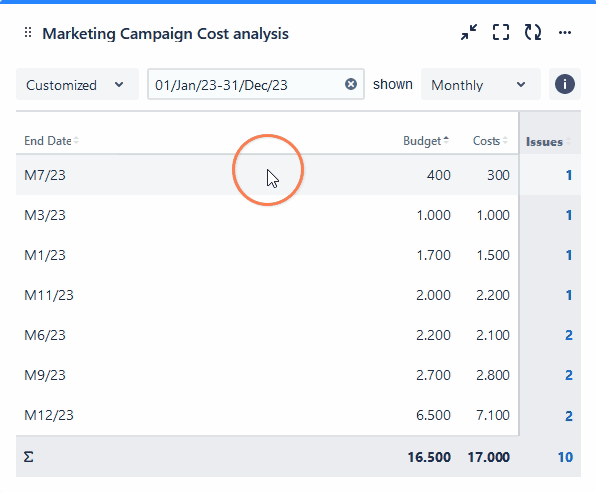
Date Filter
An additional filter appears at the top when a date field is selected to show (group by) on the y-axis, allowing you to view the data in a custom time period and aggregation level. It is pre-populated with the configuration value and contains the following options:
|
Options |
Explanation |
|---|---|
Time Period
|
Set the period which you want to display: Current week, Current month, Current quarter, Current year, All-time. |
Date Picker
|
The picker allows you to override the Time period selection. Select the start and end dates by clicking on the dates. Click next to the expanded calendar to enter your chosen date. If the date range is not customized, it reflects the chosen Time period (e.g., 01/Jan/24-31/Dec/24 for Current year). Adjusting the date range changes the Date Filter View to Customized. |
Date Grouping
|
Define how you want to group the data: Daily, Weekly (W1, W2, W3, ...), Monthly (M1, M2, M3, ...), Quarterly (Q1, Q2, Q3, Q4), Yearly (Y/22, Y/23, Y/24, ...). For data spanning more than one year, Weekly, Monthly, and Quarterly data will display the year as a suffix (e.g., Q1/24). |
Info Icon
|
The tooltip |
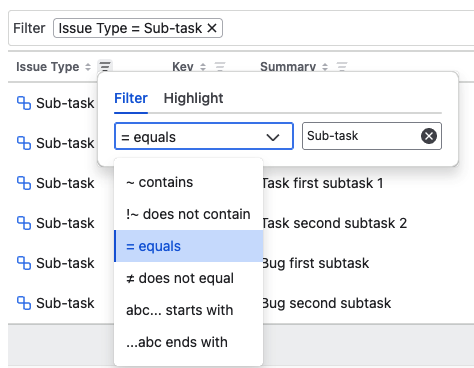
🔽 Advanced column filtering
Unlock deeper insights and eliminate manual searching with our new intelligent column filters. Instead of scrolling through endless rows, you can now isolate critical information in seconds using filtering logic tailored to your specific data.
Pro tip: Apply filters to multiple columns to narrow your results further. The gadget automatically combines your criteria using logical AND, displaying only the records that meet all specified conditions.
Good to know
-
Filters are saved per user and remain persistent even after a page refresh.
-
If you update the Field to sum setting, please manually clear any existing filters. Filters are stored independently of the configuration settings and will not reset automatically.
🖌️ Conditional cell highlighting
Identify important data quickly without filtering, isolating, or losing the context of your current gadget view. Shed light on what matters most in your gadget data. Define highlight rules for a column, such as marking priority values like “Highest” or “High,” and matching cells will be visually emphasized using your chosen highlight color.
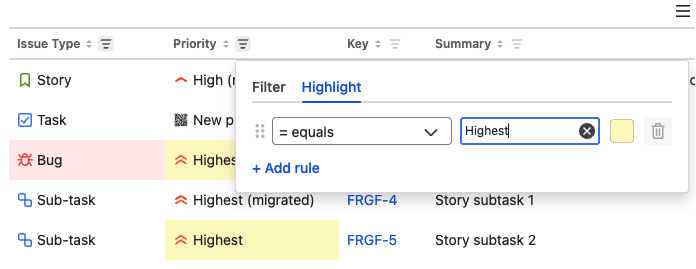
Pro-tip: You can define up to 3 highlight rules per column and can add highlight to as many columns that are present on the gadget table.
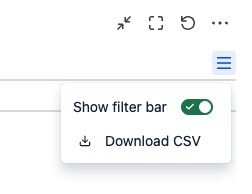
📥 Export / download CSV
You can now download the gadget table as a CSV file directly from the gadget. Simply open the in-app menu and select Download CSV to export the full table for offline use, sharing, or further analysis.
📚 Use Cases And Examples
| Use Case | Description | Gadget |
|---|---|---|
| Work items due this week |
Get a weekly overview of the upcoming work items due for each assignee. |
Two Dimensional Filter Statistics |
| Project Work Item Overview |
Display the number of work items within a project, grouped by status and Work item type for better project tracking. |
Two Dimensional Filter Statistics |