The Audit log tracks the execution of post functions, conditions, and validators. It provides filtering, export options, and detailed views to review logs and configuration details.
Location
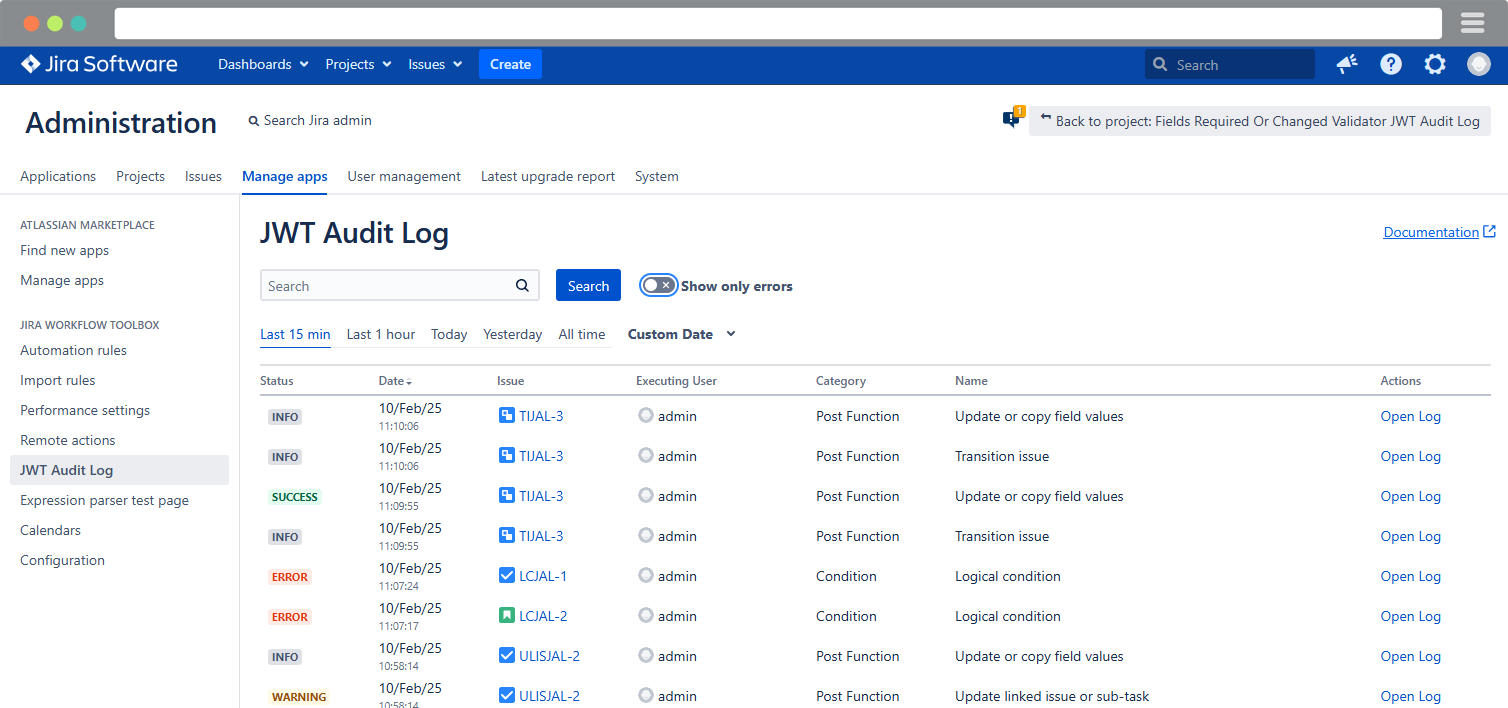
The Audit log overview page is located under Manage apps, in the Jira Workflow Toolbox section.
User interface
• Filter options
The Search bar allows you to find specific log entries by issue, category and name.
Additional filter options include the error filter, which displays only error entries, and time filters, which allow you to view logs from predefined time ranges such as the last 15 minutes, last hour, today, yesterday, all time, or a custom date range.
The error filter and the last 15 minutes filter are selected by default.
• Overview table
The Overview table provides a summary of key events and activities. It includes the following columns:
-
Status, Date, Issue (with Issue Key)
-
Executing User
-
Category
-
Name (of the Post function, Condition, or Validator)
-
and Actions (Open Log)
• Open log details
The Open log button opens a detailed window.
• Documentation link
The Documentation link takes you directly to our documentation for detailed explanations.
Detail window
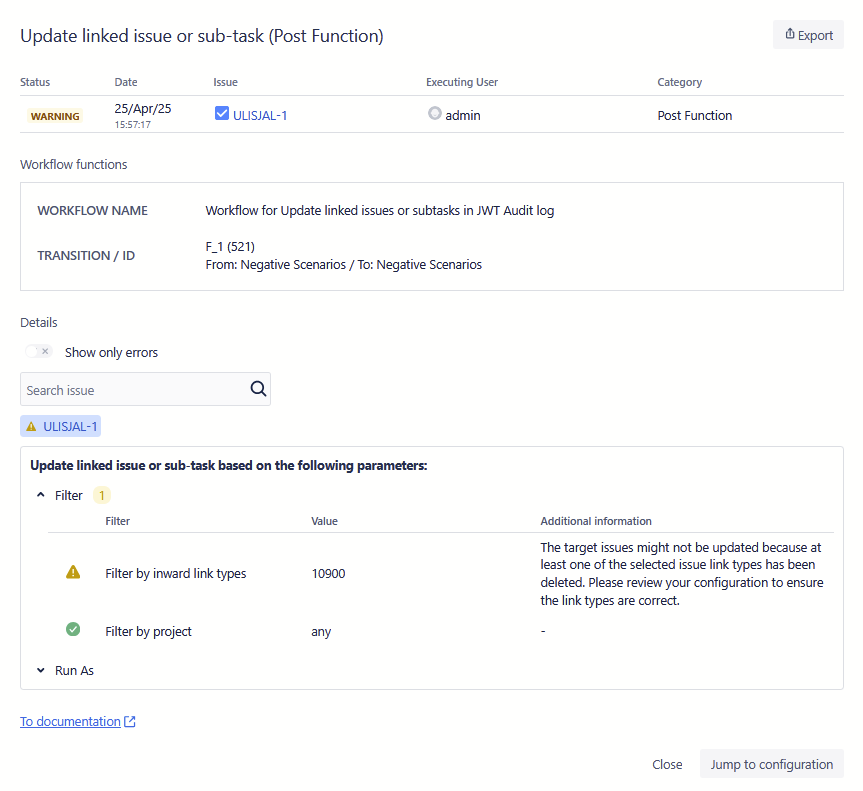
In the detail window, the function name and its category (e.g., Update linked issue or sub-task (Post Function)) are displayed at the top left, while the Export button is located at the top right to download the selected log entry for further analysis.
• Error log table
The Error log table provides detailed log entry information.
-
Status: shows success or failure (e.g., ERROR).
-
Date: records the timestamp.
-
Issue: links to related issues.
-
Executing user: lists the user who triggered the function.
-
Category: specifies the function category.
• Export functionality
The Export button allows you to download the current log. The Audit Log entry is always included in the export, while Workflow XML and the most recent Support ZIP can be selected optionally.
• Workflow functions
In the Workflow Function section, the Workflow Name, the corresponding Transition Name and ID, as well as the Transition Change, are displayed.
• Details
The Details section includes the Show only errors filter to display only those issues where errors have occurred, a search bar to locate specific issues, and a list of issues that have been updated or affected by the execution.
Below this, the section mirrors the structure of the JWT function Configuration screen, displaying the configuration used during execution. Next to each corresponding section are numbers indicating the number of notifications, categorized by input status such as Warning, Error and Info.
Each category can be expanded to show further details.
The Details section includes the following elements:
-
Show only errors: A filter that displays only issues where errors occurred.
-
Search bar: Allows users to find specific issues.
-
List of affected issues: Displays issues that were updated or impacted by the execution.
Additionally, numbers next to each relevant section indicate the number of notifications, categorized by input status:
-
Warning
-
Error
-
Info
Each of these categories can be expanded to reveal further details, including:
-
Function-specific context: Displays details depending on the function that was executed.
-
Value: Represents the final result. Depending on the configuration, this can be either a predefined plain text value or the evaluated result of an expression.
-
Additional information: Other relevant details.
• Quick access features
The Detail Section also includes a link to our public documentation. In addition, a Jump to configuration button is available within the window to navigate directly to the configuration of the JWT function that generated the log entry. The configuration will open in a new tab with the relevant settings. Starting with JWT 3.5.0, the section will be highlighted.
Entry statuses
|
Status |
Description |
|---|---|
|
Success |
Everything worked correctly. |
|
Info |
The function was executed, but a configuration option influenced the outcome. For example, in the Update or Copy fields post function, if the goal is to update the parent issue but the current issue is not a sub-task, no parent is available to update. However, if the post function is executed on a sub-task issue, it would run without any problems. The INFO status indicates that the configuration does not need to be updated, as the post function, condition, or validator may execute successfully in other cases. |
|
Warning |
The function was executed, but some configuration options are broken and need to be fixed. For example, in the Update or Copy fields post function, if the configuration attempts to update a field that has been deleted, this part of the configuration will never work until it is corrected. However, if the configuration includes updating two fields and only one of them is deleted, the other field will still be updated correctly. In this case, the overall status would be WARNING, as the configuration is not entirely functional but is partially working. Importantly, everything else in the transition remains unaffected, unlike cases with an ERROR status where execution is entirely disrupted. |
|
Error |
The most severe status is ERROR, which indicates that the function was not executed correctly due to a critical error. For example, if a parser expression is corrupt and cannot be evaluated, the execution of the post function, condition, or validator is immediately aborted. In such cases, nothing works, and the issue must be fixed as it breaks the entire transition, not just the specific post function, condition, or validator. If a transition includes multiple post functions and one fails with an ERROR, none of the others will be executed, and the transition will not be completed. This is why a single log entry can contain at most one ERROR, as execution stops immediately after it is encountered. In contrast, a log entry can contain multiple INFO, WARNING, and SUCCESS statuses simultaneously. |
It is important to note that a single log entry can have multiple statuses: one final status, which represents the overall status for the entire log entry, and individual statuses for each configuration option listed in the detail section. The log entry will always have the most severe status as final status. So it could be that in one log entry there are WARNINGS and INFOS. As WARNING is the "higher" status, the final total status of the log entry will be WARNING.
Order is: Error > Warning > Info > Success
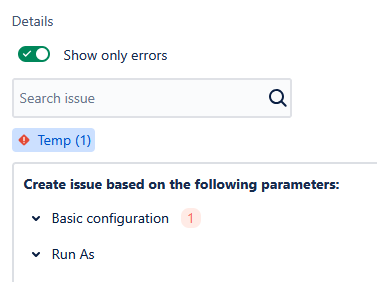
Special case: Create issue post function
The Detail section shows issue keys affected by the execution. For Create issue, this works differently. Issues are tracked using temporary keys (Temp(<index>)) during creation. These placeholders exist only in memory until Jira assigns final issue keys, replacing them in the audit log. If issue creation fails due to configuration problems, the temporary key remains in the log. Once all issues are successfully created, the temporary keys are replaced with their corresponding issue keys in the audit log.
Log retention period
The Log retention period can be configured under Manage Apps → Jira Workflow Toolbox → Configuration and is set to 90 days by default.
List of functions displayed in the audit log
Here is a complete list of all features included in audit log monitoring.
-
Conditions
-
Logical condition
-
-
Validators
-
Fields required or changed
-
Logical validator
-
-
Post Functions
-
Update or copy field values
-
Send email
-
Create issue
-
Transition issue
-
Add comment
-
Update linked issue or sub-task
-
Add or remove watchers
-
Assign to project role
-
Create issue link
-
Move issue
-